Arthritis Society Canada relies upon the generosity of people like you to help us provide funding for arthritis research, proactive advocacy and education programs that benefit the six million Canadians living with arthritis. Our annual reports are a yearly snapshot of your impact. This is how we report back to our donors about the outcome of their investment in Arthritis Society Canada and share the stories of resilient Canadians with arthritis.
Financial Reports
How we are funded
Arthritis Society Canada relies upon the generosity of people like you to help us provide funding for arthritis research, as well as treatment and education programs that benefit many of the over six million Canadians living with arthritis.
Funds are raised primarily by the provincial/territorial divisions of Arthritis Society Canada. The major sources of revenue include support from the public by way of donations and special events, and support from corporate Canada, government departments and other agencies.
Financial Statements
- 2025 Financial Statements
- 2024 Financial Statements
- 2023 Financial Statements
- 2022 Financial Statements
- 2021 Financial Statements
- 2020 Financial Statements
- 2019 Financial Statements
- 2018 Financial Statements
- 2017 Financial Statements
- 2016 Financial Statements
- 2015 Financial Statements
- 2014 Financial Statements
- 2013 Financial Statements
- 2012 Financial Statements
- 2011 Financial Statements
- 2010 Financial Statements
- 2009 Financial Statements
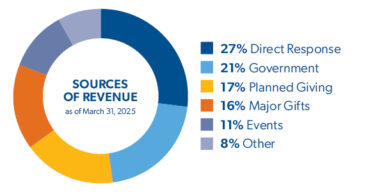
How are our funds raised?
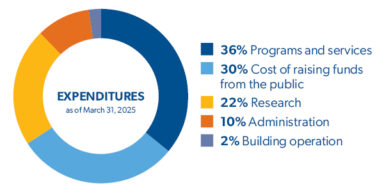
How are our funds spent?
T3010
T3010 Registered Charity Information Returns
Explore our annual T3010 submissions to the Canada Revenue Agency (CRA) that provide additional transparency of Arthritis Society Canada’s operations, financials, and compensation.