
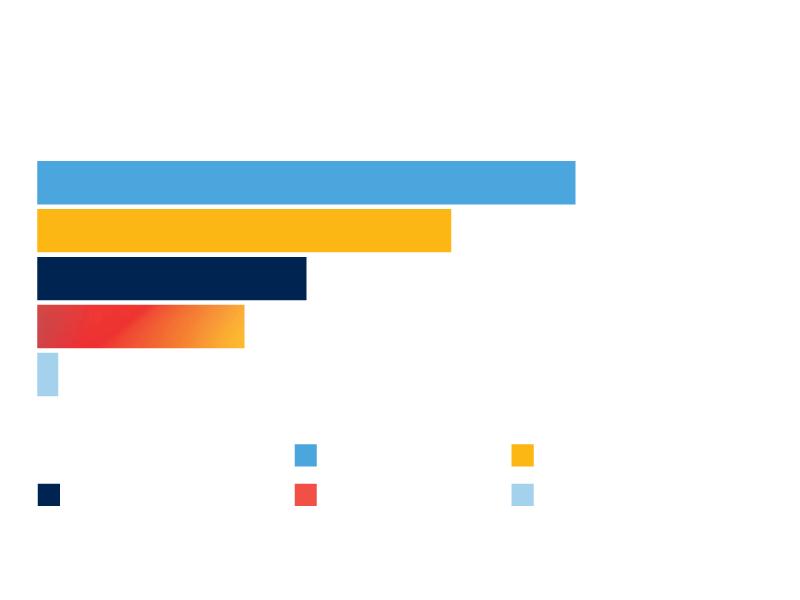
Sources of Revenue
Expenditures

For year ended March 31, 2022
Statement of Financial Activities
Year ended March 31, 2022, with comparative information for 2021.
| 2022 | 2021 | |
|---|---|---|
REVENUE |
$ | $ |
| Major Gifts (corporate, individual and foundations) | 3,194,156 | 2,720,943 |
| Planned Giving | 4,904,786 | 4,991,455 |
| Direct Response | 7,795,839 | 7,564,618 |
| Events (including Move Your Way) | 204,707 | 746,730 |
| Other | 2,448,796 | 2,920,779 |
| Government | 6,521,390 | 7,508,11 |
| TOTAL REVENUE | 25,069,675 | 26,452,635 |
EXPENSES |
$ |
$ |
| Research | 5,247,265 | 3,556,737 |
| Programs and services | 9,809,390 | 8,979,077 |
| Building operation | 668,474 | 658,601 |
| Administration | 2,324,635 | 2,629,589 |
| 18,049,764 | 15,824,004 | |
| Cost of raising funds from the public | 7,447,313 | 7,901,130 |
| TOTAL EXPENSES | 25,497,077 | 23,725,134 |
EXCESS (deficiency) of revenue over expenses |
*(427,402) |
2,727,501 |
*Reflects an approved investment out of a prior-year surplus to execute a comprehensive campaign to boost public awareness and give voice to people living with arthritis.
Accreditation
The Arthritis Society is accredited by the Imagine Canada Standards Program, Canada’s highest measure of excellence for charities and not-for-profits.

“Our personal experience with arthritis has led us to getting more involved. We believe that research and developing better treatments are the key to unlocking a cure and that’s our end goal.”
~ Anny Nasser and Sikin Kassum-Dharamshi, co-chairs of inaugural Arthritis Fire BallTM fundraising gala taking place in November 2022